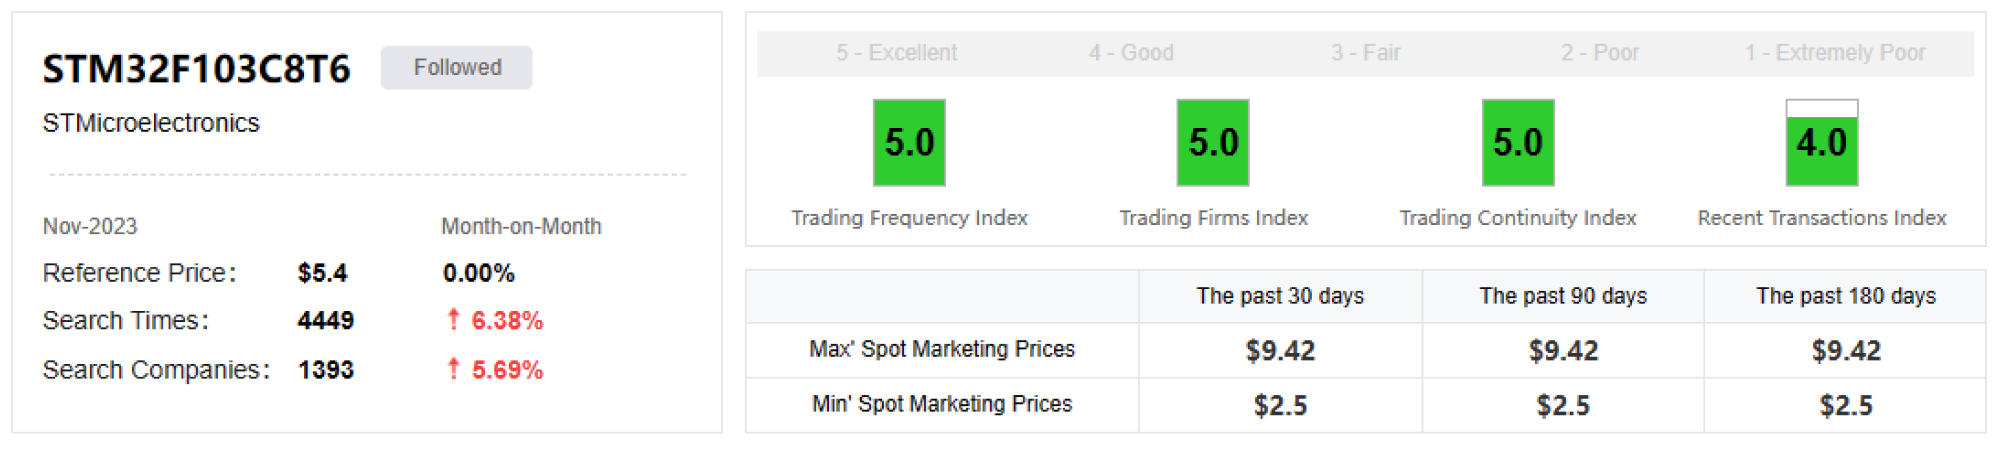
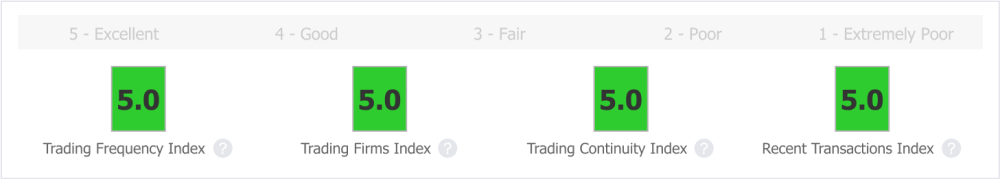
Parts Insight

Parts Insight is a tool for detailed analysis of a particular parts. Parts Insight provides you with data on searche times, the number of company searching, the price range, the frequency of transactions, the number of company trading, the persistence of transactions, and recent transactions for a particular part. It helps you get a clear picture of the market trends for a particular part.
·199USD/yr
Apply Now
Already opened the service, log in now
Click the following parts to trial:
STM32F103C8T6
STM32F407VET6
LM358
STM32F103RCT6
STM32F405RGT6
STM32F030C8T6
ULN2803ADWR
TMS320F28335PGFA
STM8S003F3P6
STM32F407VGT6
MCIMX6G2CVM05AB
STM32F030K6T6
ATMEGA2560-16AU
STM8S003F3P6TR
ATMEGA128A-AU
ATMEGA8A-AU
STM32F103VCT6
TPS5430DDAR
LM358DR
ATMEGA328P-AU

Spot Marketing Data

Provides you with Reference Price, Search Times, Search Companies data of last month and the previous month, you can quickly understand the situation of the part in the recent month. In addition, you can also access Max' Spot Marketing Prices and Min' Spot Marketing Prices to know the price range of China spot market.

Trading Index

The Trading Index consists of 4 indices: Trading Frequency Index, Trading Firms Index, Trading Contnuty Index, and Recent Transactons Index, with each Index having a minimum score of 0 and a maximum score of 5. The data comes from the Trading Data BomAl Chinese version and international version of the platform, through the AI algorithm will be converted into indices. You can easily understand the trading situation of a certain model in the Chinese market through the trading index.

*Trading Frequency Index:The higher the index, the more frequently the part is traded in the market.

*Trading Firms Index:The higher the index, the higher the number of firms involved in the parts' trading.

*Trading Continuity Index:A higher index indicates that the part is continuously traded.

*Recent Transactions Index:A higher index indicates that there have been recent orders and that there is demand in the market.

Trend chart

Provides you with monthly data for the last two years and daily data for the last 30 days for a particular part number. The charts give you a better visualization of the changes in Search(Companies) Trends and Prices Trends.

·Understand the recent market changes through the 30-day curve changes.

·Understand the changes in the market and the cyclical changes during the year by looking at the changes in the curve over a 24-month period.

·Compare Search Trends and Search Companies Trends to find out if searches are really rising.

·Compare Search (Companies) Trends and Prices Trends to find out whether the market demand is rising or falling.

Data Download

You can easily download Monthly Data and Daily Data containing data such as Search times, Searching Companies and Reference Price. You can use this data for more business analyses and prepare reports on your work.